
Ümit Sayin’s article is cited: “What does science say about whether or not women can learn to experience overlapping orgasms or status orgasmus (“SO”)?” The article contains two figures, and one table, worth looking at.
Figure 1 of the article is titled “Classical female orgasm pattern, defined in the classical medical literature”.
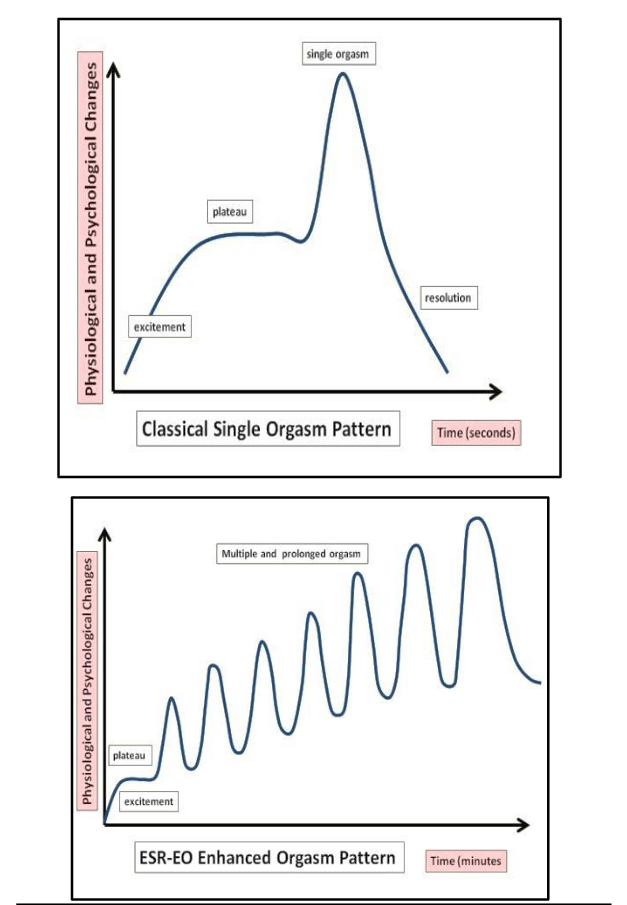
Figure 1 contains four graphs, A, B, C, and D. Each graph depicts a type of orgasm. Graph D depicts overlapping orgasms or status orgasmus (“SO”). There are several items of note regarding Panel D:

- The x-axis on the graph is time. The y-axis is, essentially, intensity of pleasure. The graph shows several orgasms, with a ‘peak’ of intensity followed by a ‘valley’.
- The valleys of each orgasm, while lower than the peaks, are above the x-axis. This is the hallmark of overlapping orgasms – one orgasm starts before the prior one ends.
- The level of intensity, measured on the y-axis, grows over time.
- The pattern of orgasms does not end, but continue indefinitely.
0 Comments